dt[?] Display instruction traces (dtr=reset)
Usage: dt Trace commands
-
To enable tracing, set
e asm.trace=1; e dbg.trace=1 -
dtList all traces dt [addr]Show trace info at address-
🚀 To count instructions, use
e asm.trace=1 / e dbg.trace=1followed bydtasciinema dt%TODOdt*List all traced opcode offsetsdt+ [addr] [times]Add trace for address N timesdt-Reset traces (instruction/calls)dtDShow dwarf trace (at*|rsc dwarf-traces $FILE)-
dta 0x804020 ...Only trace given addresses -
dtdList all traced disassembled-
Show disasm of each instruction traced
-
-
dtgGraph call/ret trace dtg*Graph in agn/age commands. use .dtg*;aggi for visualdtgiInteractive debug trace-
dtrShow traces as range commands (ar+) -
dtt [tag]Select trace tag (no arg unsets) -
Screenshot
-
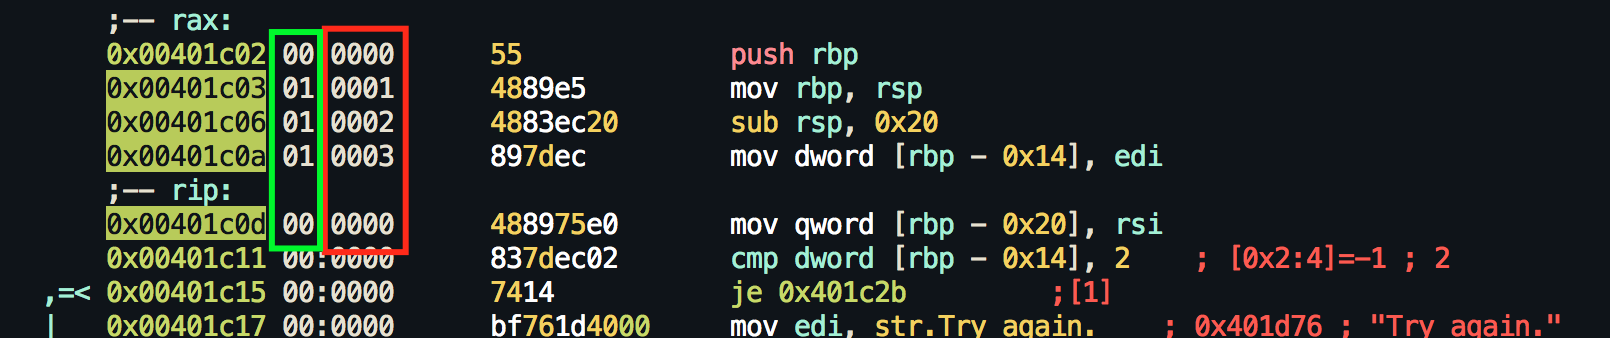
dtThe numbers in the red box indicates the order of the trace count as each instruction is stepped into, and the green box indicates how many times that instruction has run
-
dt dt% dt* dt+ dt- dtD dta dtc dtd dte dtg dtg* dtgi dtr dts dtt